
Mythology in C++: Exceptions are Expensive
|
|
Home |
 |
Back To Tips Page |
|
|
Mythology in C++: Exceptions are Expensive |
|
The PDP-11 was a cool little machine. It was first released by Digital Equipment Corporation in 1970, as the next logical step in the minicomputer evolution. It had a really cool instruction set, a really cool interface bus, and people who saw it fell in love with it.
Including the people at Bell Labs, such as Ken Thompson, one of the architects of Unix.
You can read more about the PDP-11 here.
Sadly, the PDP-11 fostered a set of nonsensical myths about programming, and the C language and C compiler embodied many of these myths. Generations of programmers learned to program, either on the PDP-11, or taught by people who learned on the PDP-11, and all these people subscribe to the same set of pointless and obsolete myths about programming.
For a while, computers were popularly rated in MIPS, Mega-Instructions Per Second. Computers which do scientific work, in particular, the class known as "supercomputers", were once rated in MFLOPS or MegaFlops, Millions of FLoating point OPerations per Second. However, that number is no longer relevant in modern discussions. For a while, the supercomputers were measured in GigaFLOPS and TeraFlops, but even those are irrelevant; modern supercomputers are measured in PetaFLOPS, and that is 1024 (or 1000 more) than TeraFlops.
For those not familiar with the terminology, here's the table
|
Exponent |
Prefix |
Abbreviation |
Value |
| 1015 | Peta | P | Quadrillions |
| 1012 | Tera | T | Trillions |
| 109 | Giga | G | Billions* |
| 106 | Mega | M | Millions |
| 103 | Kilo | K | Thousands |
| 10-1 | Deci | d | Tenths |
| 10-2 | Centi | c | Hundredths |
| 10-3 | Milli | m | Thousandths |
| 10-6 | Micro | μ (or u) | Millionths |
| 10-9 | Nano | n | Billionths* |
| 10-12 | Pico | p | Trillionths |
| 10-15 | Femto | f | Quadrillionths |
|
*"Billion" is a U.S. term which has different meanings in other languages, so often is referred to in international documents as "thousand million" or its inverse, "Billionths" as "Thousandths of Millionths" |
|||
The PDP-11 instruction rate was about 300 KIPS (0.3 MIPS). But in a 2 GHz x86, you have to recognize that the x86 can dispatch several instructions per clock tick; in the Pentium 4, the CPU could dispatch two integer and one floating-point operation in a single clock cycle, and most instructions execute in one clock cycle, so on the average (assuming cache-friendly data layout) an x86 can run at 4GIPS. Giga Instructions Per Second. That's more than 13,000 times faster than a PDP-11! Note that the new "Core" series from Intel can dispatch (depending on the model) between five and seven instructions per clock cycle. There are other significant architecture changes that change the performance picture even more, and I will discuss those later.
Given the amazing increase in hardware performance and address space, rules for "clever" programming on the PDP-11 become largely irrelevant on an x86. In addition, the C compiler used for the PDP-11 was one of the worst-quality code generators in the history of compilers; even the IBM FORTRAN compiler for the 7094 could do better!
For example, C programmers who want to do an infinite loop, and who learned on the PDP-11 (or were taught by PDP-11 programmers) may write
for(;;) {...body of loop...}
instead of the much more sensible
while(true) {...body of loop...}
Why is this for(;;) idiom so popular? Not because it makes sense as a syntactic structure. But the compiler was so stupid it did not recognize that true is a compile-time constant, and generated code like
loop_start:
   mov r0, 1
   test r0
   jne loop_exit
   ...body of loop
   jmp loop_start
loop_exit:
Even in the days when C was popular on the PDP-11, there were compilers that would happily compile the code for white(true) as
loop_start:
    ... body of loop
    jmp loop_start
The poor PDP-11 C code generator produced horrible code, so programmers avoided writing clear code to save one instruction. But when your code space was 32K (in some machines, you only had 32K for both code and data; other models of the PDP-11 had what were called "separate I and D space"), and you could execute only 300 KIPS, this mattered. With modern architectures and modern compilers, such grotesque hacks are no longer required. (The Bliss-11 compiler, written in 1972, could do such an optimization, and I used it for several years). When you have a 2GB user address space, and can execute billions of instructions per second, the tradeoffs are much different.
The similar foolishness of writing
if( (v = ...somecomputation...) != 0)
instead of more sensible
v = ...somecomputation...;
if(v != 0)
was based on the fact that the non-optimizing PDP-11 compiler would do, for the non-embedded assignment
; 324 v = ...somecomputation...
r0 = ...somecomputation...
mov v, r0
; 325 if(v != 0)
mov r0, v
test r0
jne  else_part
where the embedded one would do
; 324 if( (v = ...somecomputation...) != 0)
r0 = ...somecomputation...
mov v, r0
test r0
jne else_part
thus saving one instruction. A modern compiler, such as Microsoft C/C++ (as far back as V6, and possibly V4.2) produces exactly the same code for both styles.
The PDP-11 is a dead technology. It is about time we buried the myths that machine and its (really poor) C compiler created. What is even more astounding, these myths have been propagated into the C++ world!
One of the common myths, one which I have actually seen in print, is the assertion "Do not use exceptions. They are expensive". This is complete nonsense.
One thing you learn in this business, if someone says "feature X has poor performance", you probably can't trust that opinion, unless it is accompanied by hard data that justifies the assertion. Most performance myths are exactly that: myths. "Subroutine call is expensive, don't create subroutines you don't need", "inlining functions gives you better performance, so inline all your functions when possible", "instantiating generics gives you code bloat" and, the topic of this essay, "exceptions are expensive".
[As an aside: subroutine calls cost, on a 2GHz machine, 250 picoseconds (on the average), you can pass four parameters per nanosecond, on the average. Subroutines have almost no cost. Compilers like the Microsoft compiler that can do global program optimization can do the inlining themselves, and the programmer does not need to make the effort, the compiler is quite capable of eliminating duplicate generic code (particularly when T* is the basic of the generic, for multiple types T) and, as this essay will demonstrate beyond and shadow of doubt, exceptions are amazingly cheap, to the point where for all practical purposes they are free.]
Let me state that the cost of handling exceptions is so low as to be irrelevant in nearly all practical applications. The difference is, I'm going to tell you why, and back it up with hard data.
In a court of law, "hearsay evidence" is not admissible (and for those of you with some experience, yes, I know there are specific exceptions to this). But the myth that "exceptions are expensive" seems to have been started without basis, and then repeated, time after time, growing in the telling, to where modern books (2011) have actually repeated this myth as if it were a fact. I spent nearly fifteen years of my career concerned with software performance, and wrote one of the definitive software measurement packages we used at Carnegie Mellon University. One thing I learned from all those years of performance measurement: If the programmer who wrote the code tells you where the code is spending all its time, he (or she) is almost certainly wrong. I would get people showing up at my office saying "Teach me how to use your timer package. I just spent the last week optimizing my code to run ten times faster, and it makes no difference!". So I'd toss their code into the timer system, and discover that the code they had "optimized" was perhaps twice as fast as the previous version (they would do silly things like confuse lines of code with performance), and that meant that instead of taking 0.5% of the total execution time of their program, it now took 0.25% of the time. Meanwhile, some other part of their system, which they had never considered, was consuming 30% of the time. In once case, I reduced that to a fraction of a percent by suggesting a one-line change ("It helps a lot, if, before formatting the line for output and deciding to discard it, you first check to see if any output is required, and not do any formatting") and in another, got tremendous improvement by reducing 4 million calls on the storage allocator to about 200,000 calls on the storage allocator. Note I had solid, objective proof, which was reproducible, that there was (or was not) a performance bottleneck in their code.
So how is it that authors and readers blindingly accept such silly concepts as "exceptions are expensive"? I have no idea. I've looked at the generated code, and therefore I don't believe it at all. But that's just an opinion. Let's back it up with a few facts.
To do this, we need to detour a bit into performance measurement techniques.
I was trained as a scientist by a physics professor. He put a lot of emphasis on experimental methodology. Among other things I learned, you need to know what you are measuring, how your measurement tools relate to that measurement, how to determine the precision of those measurement tools, their reproducibility and reliability, and their statistical reliability. So when I have to do performance measurement, all these things matter.
Another thing I learned about doing science, in my geology classes in the late 1980s: sometimes, the absolute values don't have much meaning, but the relative values have tremendous meaning. (The particular case, of potassium-argon dating, is based not on the absolute amounts of potassium or argon, but their ratio). So what you do is create an experiment, and then perturb the experiment in a known way, and perform the experiment a second time, and the difference between these two experiments can be of interest.
It is a sad fact that designers of operating systems and hardware make little provision for doing precise performance measurement. I once wrote an essay on requirements for doing good performance measurement, and these ideas were proposed in 1973 or thereabouts. No one has caught on, in all these years.
There have been some improvements. The RDTSC instruction of the x86 architecture, for example, reads the high-performance CPU timer, a 64-bit value that is essentially a counter of CPU clock cycles. This is not bad, but it is not perfect, for a variety of reasons.
For example, naive use of RDTSC will fail unless you take the instruction pipelining effects into consideration; you do not want this instruction to be prefetched, because the pipeline state can therefore perturb the reliability of the numbers obtained. Therefore, you must use a serializing instruction ahead of each RDTSC instruction, to synchronize the instruction pipe. The only user-level serializing instruction available is the CPUID instruction.
For high-resolution timing, the RDTSC instruction is wrapped in an API call, QueryPerformanceCounter. This API will return a count of the number of units (which are a little coarser than CPU clock cycles) executed since the machine was booted. By doing two calls and computing their difference, a good approximation of the amount of time expended can be made.
The number of ticks returned by QueryPerformanceCounter can be converted to absolute time values by using the QueryPerformanceFrequency call to get the conversion factor.
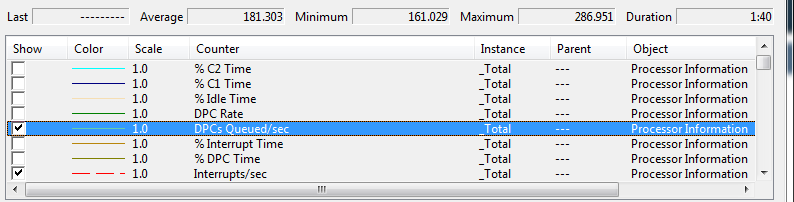
Note that I said "a good approximation". There are many factors that interfere with precise information. For example, if there is an interrupt then the interrupt time gets charged against the currently running user thread. Similarly, if a Deferred Procedure Call (DPC) is executed, its time gets charged against the currently running user thread. Using the perfmon tool, you can see how many interrupts per second or DPCs per second occur. The statistics shown here are for an 8-core system.
 \
\
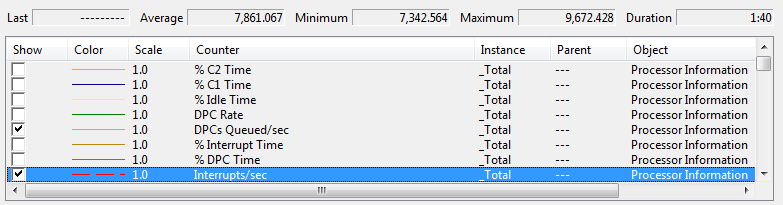
Note that there are approximately 1,000 interrupts per second per core, and about 22 DPCs per second per core. These will distort user-level measurements.
There is a lot of confusion about the meaning of timer mechanisms that purport to measure time. For example, GetTickCount returns a DWORD value of the number of milliseconds that have elapsed since the system has started. This is the timer that most clueless newbies use to attempt to do timing, although it is nearly completely useless for almost any timing measurement whatsoever.
A classic error is confusing the units that are returned with the precision of the measurement. GetTickCount returns a value based on the motherboard timer resolution, and although the value returned is measured in milliseconds, it is updated only once every 15 milliseconds on most modern platforms. The actual time resolution can be obtained with GetSystemTimeAdjustment. What this means is you will be subject to massive gating error issues. A function which takes 10 microseconds may call GetTickCount 5 microseconds before the timer ticks, in which case you will get a time value T. 10 microseconds after this call, it calls GetTickCount again, and discovers that the value it gets back is T+15, which means it took 15 milliseconds to execute. Or, if you call GetTickCount at an time within the 15ms window, you will see that this function takes 0 milliseconds. Both numbers are irrelevant and misleading.
The problem with sampling within the tick interval, or across it, is known as gating error, which is the effect of measuring discrete events within discrete time intervals. If the events (timer ticks) are close to the interval being measured then normal error of ±½ unit begins to dominate when a large number of small samples are taken. In the case of GetTickCount, a unit is 15ms, so the range of ±½ unit is a possible 15ms error. When the tick interval is very small, the errors are correspondingly smaller. This is also related to the Nyquist (or Shannon-Nyquist) sampling theorem, which says that you need to sample a waveform at twice its frequency (or scan a pixelated image at twice the resolution of the pixels) to get a reasonable representation.
Now let's look into one other cute little problem with GetTickCount. It counts the number of milliseconds from system startup, in a 32-bit DWORD. How long is this interval? It wraps around every 1193 hours (4,294,967,296 / 1000 / 60 / 60) or almost 50 days. Now, there are some weird people out there who turn off their machines every day, but my machine stays up 24/7/365, and gets rebooted only a few times a year. So if you read the GetTickCount value just before you get 32-bit overflow, and just after, it looks like your subroutine took 50 days to execute (49 days, 17 hours, 2 minutes and 24 seconds, if I believe my calculator).
Pretty much all the timing mechanisms other than QueryPerformanceCounter are useless because they all depend on the 15ms motherboard timer tick. Thus they are unsuitable for measuring any code that can execute in less than 30ms. Since a 2GHz machine can execute 4 instructions per nanosecond, 4000 instructions per microsecond, or 4,000,000 instructions per millisecond, you can execute 60,000,000 instructions within one timer tick Since you need to sample intervals that are two timer ticks to get meaningful data, that means 120,000,000 instructions have to be executed within a code sequence to get meaningful results with a motherboard clock-tick-based timer. That's a lot of work, and is essentially unrealistic too use a 15ms timer for obtaining good performance data for most applications.
If you read the DDK, you will find this admonition about the kernel call KeQueryPerformanceCounter
Use this routine as infrequently as possible. Depending on the platform, KeQueryPerformanceCounter can disable system-wide interrupts for a minimal interval. Consequently, calling this routine frequently, as in an iteration, defeats its purpose of returning very fine-grained, running time-stamp information. Calling this routine too frequently can degrade I/O performance for the calling driver and for the system as a whole.
The operative term here is "depending on the platform". There is no such behavior for Intel or AMD platforms; this paragraph is sometimes known as "the Citrix paragraph" because at one time, a company called Citrix (which now does other things) manufactured an x86 clone. This clone did not have the RDTSC instruction, so to implement KeQueryPerformanceCounter with the same degree of accuracy as the function required involved simulating a high-performance counter behavior. Often, this paragraph makes its way into application-level programmers' knowledge, and they sometimes don't know the source, and even more rarely know the history. It does not apply.
How reliable is QueryPerformanceCounter? Well, we need to measure small intervals so we are less likely to be perturbed by context swaps. We shouldn't measure too small an interval because, statistically, we will be severely impacted by gating error.
Note that if you don't know the reliability of your measurement tool, you don't know the validity of your measurements.
So how can we determine how reliable our measurements are? One conventional statistical model is standard deviation. The simplistic model of this is to compute the mean of a set of samples, then compute the square of the difference of each sample from the mean. So, for example, if I collect a million samples, then I have to have an array of a million elements, so that once I compute the mean, I can then compute the deviation of each sample from the mean. A bit heavy-duty. The resulting computation is called the variance, s2, and the standard deviation is the square root of the variance.
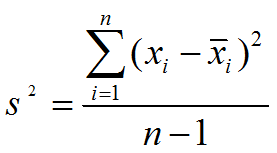
However, there is a much simpler computation, an equivalent formula, which is
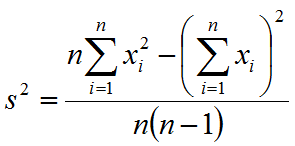
This formula requires only three variables: one to hold n, the number of samples (which in some experiments will be a constant), one to hold Σxi2, and one to hold Σxi.
Thus the code is very simple:
double sumx = 0.0;
double sumxsquared = 0.0;
for(int i = 0; i < n; i++)
   { /* perform experiment */
    double x = ...compute sample value
    sumx += x;
    sumxsquared += x * x;
   } /* perform experiment */

double var = (n * sumxsquared - (sumx * sumx)) / (n*(n - 1));
// sumx / n is the mean
// sqrt(var) is the standard deviation
This means that, when doing a scientific experiment (not just a handwave) there is no reason to not know the reliability of a measurement.
The standard deviation is often referred to as "sigma", the Greek letter σ. So we talk about something being "one sigma out" meaning it is within one standard deviation on the normal curve. Hence the quality program name, "six sigma", which means the statistical probability of failure is six sigmas out from the mean on the normal curve. A six sigma process is one in which 99.99966% of the products manufactured are statistically expected to be free of defects (3.4 defects per million). (The only reason this is interesting is that it motivates the name of the function I wrote, which is called sigma).
The experiment was to call a function which did nothing, and call a similar function that had a try/catch block which also did nothing. The difference in cost between the two calls represents the cost of the exception frame.
The two functions which are called are
__declspec(noinline) void DoSomethingExcp()
    {
    try {
         DoOther();
        }
    catch(int)
        {
         ReportCatch();
        }
    }

__declspec(noinline) void DoSomething()
    {
     DoOther();
    }
There are some support functions that are provided
__declspec(noinline) void DoOther()
    {
    }

__declspec(noinline)void ReportCatch()
    {
    }
Note the use of __declspec(noinline). When conducting experiments of this nature, it is essential to defeat the implicit inlining the compiler can do, Otherwise, the entire program collapses to nothing, because the compiler can detect that the function bodies do nothing, and therefore will not even bother to generate the call. So if you do not define this global optimization, the calls to DomSomethingExcp and DoSomething will generate no code, which of course would distort the experiment. It is essential in such cases that you understand what you are measuring, and if you are measuring empty code bodies you are not measuring anything useful.
The code below shows the debug mode version of the code. I have highlighted the instructions which are added to handle the try/catch mechanism. Note that the FS: segment register is a pointer to the thread context block, and the 0th element of this block is the pointer to the current exception frame. Whenever a thread is scheduled to run, the operating system sets the FS: register to the context block for that thread; thus the exception frames are per-thread.
Note that this adds six instructions. That's 29 bytes of code. The Xeon is a superscalar architecture, which means it has multiple ALUs and can dispatch multiple instructions per clock cycle. A clock cycle is the inverse of the processor speed in GHz, so a single clock cycle on this machine is 470 picoseconds. Since two instructions can be dispatched per clock cycle, the average instruction time (not counting data fetch time) is 235 picoseconds. That turns into a little over 4 instructions per nanosecond. So we should be able to predict that the six instructions would add about 1.5 nanoseconds to this function. Cache hits turn out to impact this performance, but there are other factors going on here. For example, there is an instruction cache on the CPU chip, which means that some of the instructions already in the I-cache. The XEON architecture does speculative execution, so it is prefetching data into the caches based upon likely future instructions (there is also a branch predictor which controls which execution path should be prefetched). The result of this is to minimize the number of cache misses that are likely to occur, particularly when the code is executed in a tight loop. The L2 cache is a write-back cache, meaning that when the value in FS:0 is updated, it is not written back to memory, but retained in the L2 cache until the cache line needs to be reused, meaning that there is no write time to memory involved here.
Note that all of these factors impact actual performance; the PDP-11 approach, of counting instruction length, counting memory cycles based on data operands, and summing these with the (multi-cycle) execution times of some instructions, is a dead model for predicting performance. You cannot think that a modern XEON performance can be computed in the same fashion that was used for an 8088. Yet some programmers still persist in thinking that instruction lengths, instruction counts, and applying a fixed memory cost based on the operand fetches are all valid ways to compute performance. You can always tell an amateur because they treat modern architectures like PDP-11s.
?DoSomethingExcp@@YAXXZ PROC            ; DoSomethingExcp, COMDAT
; 15   :     {
  00000 55                push    ebp
  00001 8b ec             mov     ebp, esp
  00003 6a ff             push    -1
  00005 68 00 00 00 00    push    __ehhandler$?DoSomethingExcp@@YAXXZ
  0000a 64 a1 00 00 00 00 mov     eax, DWORD PTR fs:0
  00010 50                push    eax
  00011 51                push    ecx
  00012 81 ec c0 00 00 00 sub     esp, 192               ; 000000c0H
  00018 53                push    ebx
  00019 56                push    esi
  0001a 57                push    edi
  0001b 8d bd 30 ff ff ff lea     edi, DWORD PTR [ebp-208]
  00021 b9 30 00 00 00    mov     ecx, 48                 ; 00000030H
  00026 b8 cc cc cc cc    mov     eax, -858993460         ; ccccccccH
  0002b f3 ab             rep stosd
  0002d a1 00 00 00 00    mov     eax, DWORD PTR ___security_cookie
  00032 33 c5             xor     eax, ebp
  00034 50                push    eax
|
Function prolog, debug mode |
00035 8d 45 f4 lea eax, DWORD PTR __$EHRec$[ebp+4] |
try setup |
; 17 : DoOther(); |
body of code |
__catch$?DoSomethingExcp@@YAXXZ$0: |
catch code (never executed) |
$LN2@DoSomethin: ; 23 : } 00068 8b 4d f4 mov ecx, DWORD PTR __$EHRec$[ebp+4] 0006b 64 89 0d 00 00 00 00 mov DWORD PTR fs:0, ecx |
try teardown |
00072 59 pop ecx 00073 5f pop edi 00074 5e pop esi 00075 5b pop ebx 00076 81 c4 d0 00 00 00 add esp, 208 ; 000000d0H 0007c 3b ec cmp ebp, esp 0007e e8 00 00 00 00 call __RTC_CheckEsp 00083 8b e5 mov esp, ebp 00085 5d pop ebp 00086 c3 ret 0 |
Function epilog, debug mode |
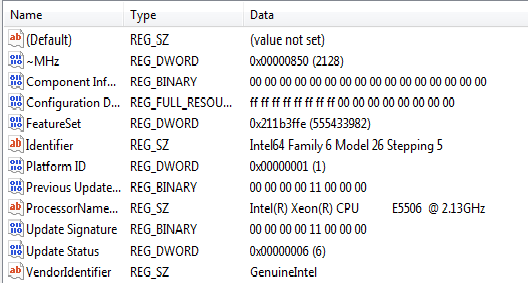
This program was compiled for a 32-bit target, using Visual Studio 2010, and run on an 8-core Dell Precision T7500 computer. The full details, from HKEY_LOCAL_MACHINE\HARDWARE\DESCRIPTION\System\CentralProcessor\0 is:
Here is the output from the program
N=1000000 tests per iteration: 100 Exception version mean = 7.431us sd = 3.909us No exception version mean= 7.185us sd = 3.739us Difference Difference per test: 246.063ns Average cost per exception frame: 2.461ns |
Note the difference between the two averages: 246 microseconds. According to this set of numbers, calling a function that uses a try/catch block takes an average of 2.5 nanoseconds of additional overhead!
So let's compile that program using the Release configuration and see what the output is:
N=1000000 tests per iteration: 100 Exception version mean = 23.366ns sd = 334.813ns No exception version mean= 23.905ns sd = 323.720ns Difference Difference per test: -0.539ns Average cost per exception frame: -0.005ns |
WHOA! This says that the exception version is 5 picoseconds faster than the non-exception version! Now, this is more than a little bit suspect. What happened here? How did we get these numbers?
Well, this is where you have to make sure you know what is being measured. Let's look at the generated code in Release mode:
; Function compile flags: /Ogtp ?DoSomething@@YAXXZ PROC ; DoSomething, COMDAT ; 26 : DoOther(); ; 27 : } 00000 c3 ret 0 |
|
; Function compile flags: /Ogtp
?DoSomethingExcp@@YAXXZ PROC ; DoSomethingExcp, COMDAT
; 16   :     try {
; 17   :         DoOther();
; 18   :         }
; 19   :     catch(int)
; 20   :         {
; 21   :          ReportCatch();
; 22   :         }
; 23   :     }
  00000 c3               ret     0
|
Note that these have exactly the same code, specifically, none at all! So the values we get are completely meaningless, and in fact what we are seeing are the effects of the standard deviation, which represents noise in the sampling!
So we haven't really measured anything! This means the compiler has ignored our __declspec(noinline) attribution.
But note those "Function compile flags" which are "/Ogtp". What do these mean?
/O is the optimization flag
So let's disable that "global optimization" option. To do this, I selected the source file I'm working with, and asked for its properties. I changed the settings to disable optimizations, as indicated here:
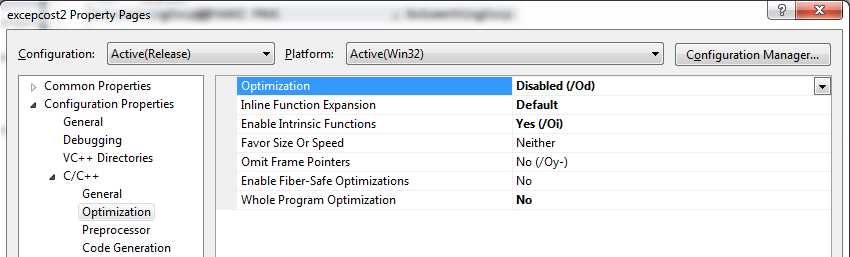
I have changed Optimization to be /Od, and Whole Program Optimization is set to No.
In addition, after inspecting the code, I chose to disable certain runtime checks, as shown below:
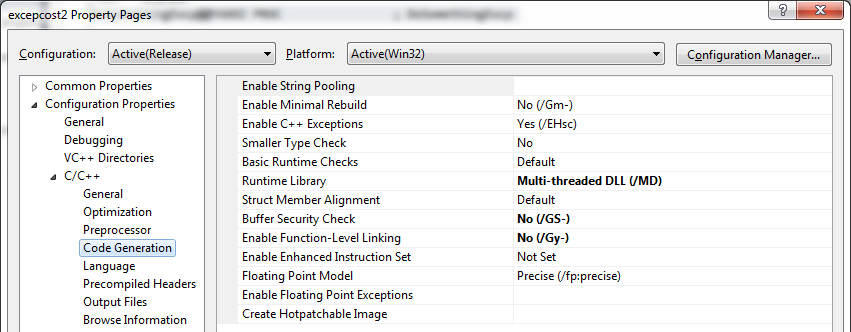
I have set "Buffer Security Check" to No and "Enable Function-Level Linking" to No.
The generated code is shown below. Note that this code involves nine instructions, for 42 bytes of instructions.
?DoSomethingExcp@@YAXXZ PROC                            ; DoSomethingExcp
; 15   :     {
  00020 55                    push    ebp
  00021 8b ec                 mov     ebp, esp
|
Function prolog |
00023 6a ff push -1 00025 68 00 00 00 00 push __ehhandler$?DoSomethingExcp@@YAXXZ 0002a 64 a1 00 00 00 00 mov eax, DWORD PTR fs:0 00030 50 push eax 00031 64 89 25 00 00 00 00 mov DWORD PTR fs:0, esp |
try setup |
00038 51 push ecx 00039 53 push ebx |
Function prolog |
0003c 89 65 f0 mov DWORD PTR __$EHRec$[ebp], esp |
try setup |
|
try body |
|
catch handler |
; 23 : } |
try teardown |
00070 5f pop edi |
Function epilog |
Now, when we re-run the code, we get another interesting result:
N=1000000 tests per iteration: 100 Exception version mean = 1.188us sd = 2.008us No exception version mean= 560.365ns sd = 1.441us Difference Difference per test: 627.405ns Average cost per exception frame: 6.274ns |
Running it a second time I get
N=1000000 tests per iteration: 100 Exception version mean = 1.119us sd = 1.159us No exception version mean= 552.066ns sd = 817.337ns Difference Difference per test: 567.246ns Average cost per exception frame: 5.672ns |
This is beginning to make a lot more sense. Note there is a slight difference between the two experiments, which is not surprising because of the fairly high standard deviation, which is now larger than the mean.
But notice that it takes longer to handle exceptions in release mode. Why? Well, let's look at the code that was generated and the times.
| Mode | Instructions | Bytes | Time | Per Second |
| Debug | 6 | 29 | 2.5ns | 400,000,000 |
| Release | 9 | 42 | 6ns | 166,666,666 |
Note that if we take the inverse of the time, we get the number of exception frames we can set per second. If I execute a program that establishes 400 million exception frames during its execution, I add one second to the total debug execution time. Big whoop. In release mode, this is reduced, I can use up a second setting only 167 million exception frames. Double big whoop. So why should I care about exception costs?
Note that the above tests were done on the 32-bit compiler. The 64-bit world is quite a bit different. For one thing, Microsoft made a decision that an "exception" is an exceptional situation. Therefore, a decision was made to implement an exception mechanism that imposes as close to zero as possible cost during normal execution, but is in fact fairly expensive when an exception is actually thrown. The way this is handled is by creating a set of compile-time tables that are all linked together to indicate which exception handler applies to which range of program-counter values. When an exception is thrown, this table is searched, and a determination is made as to where the associated exception handler code is found.
So let's look at the code generated for an x64 platform. Note that this is again compiled with optimizations disabled
?DoSomethingExcp@@YAXXZ PROC                            ; DoSomethingExcp
; 15   :     {
$LN9:
  00020 48 83 ec 38                 sub     rsp, 56             ; 00000038H
  00024 48 c7 44 24 20 fe ff ff ff  mov     QWORD PTR $T88972[rsp], -2
|
Function prolog |
; 16   :     try {
; 17   :         DoOther();
  0002d e8 00 00 00 00   call    ?DoOther@@YAXXZ                ; DoOther
  00032 90               npad    1
$LN7@DoSomethin:
; 18   :         }
; 19   :     catch(int)
; 20   :         {
; 21   :          ReportCatch();
; 22   :         }
; 23   :     }
|
try body |
00033 48 83 c4 38 add rsp, 56 ; 00000038H 00037 c3 ret 0 ?DoSomethingExcp@@YAXXZ ENDP ; DoSomethingExcp ; Function compile flags: /Odtp _TEXT ENDS |
Function epilog |
text$x  SEGMENT
$T88972 = 32
?catch$0@?0??DoSomethingExcp@@YAXXZ@4HA PROC ; `DoSomethingExcp'::`1'::catch$0
; 19   :     catch(int)
  00000 48 89 54 24 10   mov     QWORD PTR [rsp+16], rdx
  00005 55               push    rbp
  00006 48 83 ec 20      sub     rsp, 32                        ; 00000020H
  0000a 48 8b ea         mov     rbp, rdx
__catch$?DoSomethingExcp@@YAXXZ$0:
; 20   :         {
; 21   :          ReportCatch();
  0000d e8 00 00 00 00   call    ?ReportCatch@@YAXXZ    ; ReportCatch
  00012 90               npad    1
; 22   :         }
  00013 48 8d 05 00 00
        00 00            lea     rax, $LN7@catch$0
  0001a 48 83 c4 20      add     rsp, 32                        ; 00000020H
  0001e 5d               pop     rbp
  0001f c3               ret     0
?catch$0@?0??DoSomethingExcp@@YAXXZ@4HA ENDP ; `DoSomethingExcp'::`1'::catch$0
|
catch handler |
Now let's compare the code from the exception-handling function with the code for the function that does not throw exceptions:
?DoSomething@@YAXXZ PROC                           ; DoSomething
; 25   :     {
$LN3:
  00040	48 83 ec 28	  sub    rsp, 40           ; 00000028H
|
Function prolog |
; 26 : DoOther(); 00044 e8 00 00 00 00 call ?DoOther@@YAXXZ ; DoOther ; 27 : } |
Function body |
00049 48 83 c4 28 add rsp, 40 ; 00000028H 0004d c3 ret 0 ?DoSomething@@YAXXZ ENDP ; DoSomething |
Function epilog |
Note that I have highlighted several pieces of code. For example, the function prolog and epilog code is highlighted in green. It is identical in both versions. The npad 1 instruction may appear to be a bit odd; this is the "nop-pad" macro and its purpose is to generate a sequence of code bytes that cause some particular alignment of the following code. This is usually done to keep the instructions aligned on a DWORD or other boundary, which can help in the time of an instruction fetch by keeping the instructions aligned to cache boundaries and memory-fetch boundaries.
The npad macro which is given in the assembly code header file listing.inc, which is found in the standard include directory, does not generate correct code for 64-bit platforms; it sometimes does operations which on a 32-bit system leave certain registers unchanged, but in the 64-bit world will cause the high-order 32 bits of a 64-bit register to be zeroed. For example, npad 2 will generate the instruction
mov edi, edi
which is a 2-byte instruction that does nothing in the 32-bit world, but in the 64-bit world it zeroes the high-order 32 bits of edi. I do not understand why an npad 1 directive was generated, because without it the next instruction would have been generated on a DWORD boundary. So either this is a compiler error or there is a serious subtlety of the x64 pipelines I am not aware of (and believe me, the compiler writers have read those sections of the Intel and AMD documentation quite diligently, more so than I have).
Notice that the only change between the exception version code and the non-exception version code is one instruction to handle the exception. It initializes that stack's exception record.
I do not currently have a 64-bit system I can run this on. When my 64-bit system comes back from the computer hospital, I will run this experiment and report on it.
People do not deal well with exponents. If I told you that the average time was 5.6×10⁻⁹ seconds, it is not nearly as interesting as saying it is 5.6ns. Years of doing performance measurement have taught me that numbers like 2345678 microseconds is not as informative as saying 2.3 seconds, and that exponents are not useful measures. So, to pretty things up, I typically use a function as shown below to convert the number to "user-level" values. While purists will point out that there are some interesting boundary conditions because of floating point representations, the truth is that this works well enough for ordinary use and I've never seen any of the potential boundary glitches.
Because I was writing a trivial one-off console app, I was using printf to produce the output, rather than _tprintf and doing everything in Unicode, as I would do for a piece of production code. So for this function, I returned an 8-bit character string, a CStringA. The console app was created with the "Use ATL" option.
 CStringA TimeToString(double t)
     {
      CStringA s;
      if(t > 1.000)
          s.Format("%11.9fs", t);
      else
      if(t > 0.001)
          s.Format("%4.3fms", t * 1000.0);
      else
      if(t > 0.000001)
          s.Format("%4.3fus", t * 1000000.0);
      else
          s.Format("%4.3fns", t * 1000000000.0);
      return s;
     }
I have also created versions of this so that the values line up in columns, e.g.
2.345s
  123ms
     456us
        789ns
which makes a nice visual display. When reporting time values, it helps a lot if the presentation is human-readable. I also would not have printed out 1000000 as the number of iterations; I would have caused it to display 1,000,000 by using the GetNumberFormat API, using LOCALE_USER_DEFAULT.
The heart of the function is the code shown below. Note that it runs an outer loop a million times (limit), and an inner loop 100 times (sublimit). The idea here is to minimize the perturbations caused by lengthy individual tests.
Another interesting statistical variant of this code, because we can compute the current mean and standard deviation, is to discard any experiment that falls outside, say, one standard deviation. Generally, it is unrealistic to maintain a million samples in an array and generate complete error bars. So the statistical formula I use is a convenient rewrite of the simplistic equation to minimize memory overheads and potential page faults in handling a large array.
for(UINT i = 0; i < limit; ++i)
     { /* loop1 */
      LARGE_INTEGER start;
      QueryPerformanceCounter(&start);

      for(UINT j = 0; j < sublimit; ++j)
          DoSomethingExcp();

      LARGE_INTEGER end;
      QueryPerformanceCounter(&end);
      double d = (double)(end.QuadPart - start.QuadPart);
      SumXiException += d;
      SumXi2Exception += (d * d);

      QueryPerformanceCounter(&start);
      for(UINT j = 0; j < sublimit; ++j)
          DoSomething();
      QueryPerformanceCounter(&end);
      d = (double)(end.QuadPart - start.QuadPart);
      SumXiNoException += d;
      SumXi2NoException += (d * d);
     } /* loop1 */

    LARGE_INTEGER freq;
    QueryPerformanceFrequency(&freq);
    double meanExceptionTicks = SumXiException / (double) limit;
    double meanExceptionTime = meanExceptionTicks / (double)freq.QuadPart;

    printf("   mean = %s\n", TimeToString(meanExceptionTime));
    printf("   sd = %s\n", TimeToString(sigma(limit, SumXi2Exception, SumXiException) / (double)freq.QuadPart));
Where we define the sigma function as
 double sigma(double n, double sumxi2, double sumxi)
     {
      return sqrt( (n * sumxi2 - (sumxi * sumxi)) / (n * (n - 1.0)));
     }
Visual Studio 2010 has a performance analysis tool. The good news, it is very good, and very powerful. The bad news is that it is very slow. It takes a long time to run a test, and an even longer time to analyze the results. But the results are useful and interesting, and I would recommend it for serious performance improvement efforts (my biases might be showing; it collects information in the same way my Bliss Timer Package did performance analysis in the early 1970s).
Not all versions of VS have the performance analyzer; the Express version certainly doesn't have it.
To start the performance wizard, use the Analyze > Launch Performance Wizard menu option. You will see a screen like this one:
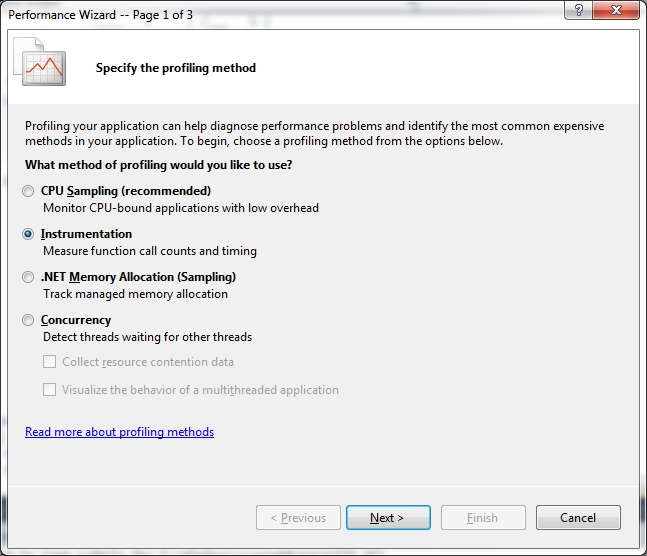
You get the highest-precision, most reliable analysis if you use the Instrumentation option. This is often far more meaningful than the CPU Sampling option. It is also very slow. If you are instrumenting a serious app, plan on starting the experiment before lunch. It means that you need to create experiments that don't involve a lot of user interaction, because the interactions will be very slow.
Due to terminal brain damage at Microsoft, VS insists that the performance report be put on the local disk. There is no sane reason this decision is preempted by Microsoft, because people like me run with no local files on our machines; I put every file on my file server. All my documents, all my projects, everything is on the file server, but Microsoft simply cannot cope with reality in this regard. I have no idea why decisions this stupid are made. Or why they think they have the right to preempt the way I work.
After it runs, you will get output similar to that shown below. Note that you will first need to select the "call tree" display, and you will have to open each level to see what is within it. If you copy the lines out, you get a tab-delimited file suitable for applications like Excel. Note that only some of the columns appear in this snapshot. Alas, one of the most important columns, the call count, which should be on the left where it is readily visible, is actually on the far right, and not visible without a lot of horizontal scrolling.
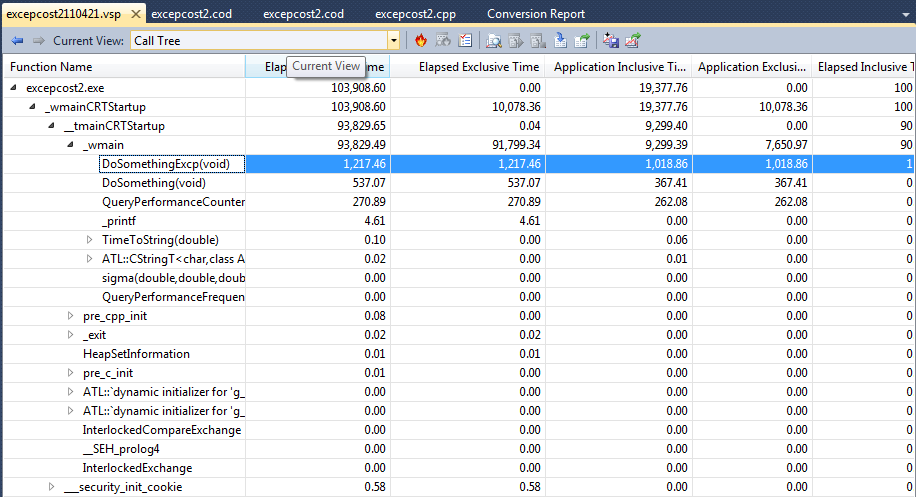
Here is a somewhat edited output; I did not include all the columns simply for page width considerations. Times are in milliseconds.
| Function Name | Elapsed Inclusive Time | Application Inclusive Time | Number of Calls |
| DoSomethingExcp(void) | 1,217.46 | 1,018.86 | 100,000,000 |
| DoSomething(void) | 537.07 | 367.41 | 100,000,000 |
What can we learn from this? Well, for one thing, we get a better picture of the time spent handling kernel tasks; the "Application time" appears to be the time actually spent in the application, and the "Elapsed time" is "wall clock" time. The "inclusive" time means the time spent in that function and all the functions it calls, which, because these functions are "leaf" functions from our viewpoint, means that this is the only number we care about. So we discover that for this experiment, which was run on a 32-bit machine using the 32-bit unoptimized release version of the code, that (1018.76 - 367.41) milliseconds, or approximately 651ms are required, across 100,000,000 calls, to set exception frames.
So how much does it cost, according to these numbers, to set one exception frame?
651×10-3 seconds / 1×108 = 651×10-11 seconds = 6,510×10-12 seconds = 6,500 picoseconds = 6.5 nanoseconds. Note that this is consistent with values I got with the experiments I did.
And, of course, observe that in 100,000,000 calls, I did not add even one second to the total run time!
The CPU Sampling method, like most bad ideas, was promulgated by Unix and treated as if it were The Ultimate Solution To All Performance Measurement Problems. The idea is that you take a timer tick notification every n milliseconds in the controlling process, and when you get one, you stop the process being measured and look at its Program Counter (known in the x86 as IP, EIP or RIP register; depending on what mode you are in, IP is 16-bit, EIP is 32-bit, and RIP is 64-bit). The idea is that if there is a "hot spot" in the program, you will find that statistically, you will be more likely to find the program counter in that hotspot.
Cute, but it is at best a poor approximation.
Many years ago, I wrote The World's Fastest Storage Allocator. This allocator was so fast, we even considered modifying the compiler to treat our equivalent of malloc/free as intrinsic functions, that is, functions that generated inline code rather than function calls. I spent hours single-stepping storage allocation requests, and tweaking the algorithm to minimize the number of instructions required to perform an allocation. The details of this allocator are described in the book IDL: The Language and its Implementation, by Nestor, Newcomer, Giannini and Stone (Prentice-Hall, 1989). The allocator itself is based on the Ph.D. dissertation of Charles B. Weinstock, and the algorithm he developed called QuickFit, (Weinstock. Dynamic Storage Allocation Techniques Ph.D. dissertation, Carnegie Mellon University, Department of Computer Science, Pittsburgh PA, 1976). One of the product groups in the company applied the Unix excuse for a performance measurement tool, and the project manager came to me and said "We have identified our performance problem. It's your allocator!" I didn't believe this, because on the average I could an allocation in three instructions and rarely needed more than about forty. So I brought up the product under the dbx debugger (predecessor of gdb, and perhaps one of the worst debuggers I have ever had the misfortune to be subjected to), reached into my allocator, and set a couple Boolean variables to TRUE. (Like the Microsoft allocator, I had two versions, the debug and release versions, and the "debug" version had a few instrumentation features compiled in). When the program finished, I used the debugger to examine some internal counters. What I learned was that the allocator had been called over 4,000,000 times! Well, the question then became "why", and a few more hours poking about with the debugger identified the culprit: a piece of code that formatted a line for output. I will show this as if it were C code (it wasn't).
char * p;
int len = ...compute length of string required...;
p = malloc(len);
...format line into buffer p
...write the line to the output file
free(p);
When we confronted the programmer, his excuse was "Well, I don't know how long the line is going to be, so I have to always dynamically allocate the buffer". I rewrote the code to be
char * p;
char buffer[SOME_DEFAULT_LENGTH]; // Actually a constant set to 80
int len = ...compute length of string required...;
if(len < sizeof(buffer))
    p = buffer;
else
    p = malloc(len);
...format line into buffer p
...write the line to the output file
if(p != buffer)
   free(p);
This had several effects
It removed the calls to the storage allocator (although it was only slightly faster than the allocator's best speed, it was about a factor of five faster than the average case,
It removed the allocator from the CPU Sampling "Hotspot" report.
The number of calls dropped from over 4,000,000 to about (if I recall) slightly over 200,000. [This was in 1982, so it was close to 30 years ago!]
So while the CPU Sampling technique can identify places that consume a lot of time, it can't tell you why it was there because the call count is not derivable from this technique.
So here is the CPU Sampling report from my performance tester program:
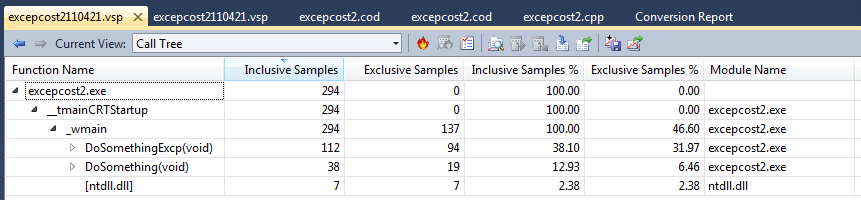
Note that there is nothing in this report (which is shown in its entirety!) that would help you deduce that there is close to zero cost for setting an exception frame. In fact, it superficially looks as if setting an exception is somewhere between a factor of 3 and a factor of 5 slower! (112 / 38 = 2.95; 94 / 19 = 4.95, to be precise) As the detailed performance experiments, both mine and using the instrumented Visual Studio analyzer, this is simply not true. Therefore, I assert that if you are truly concerned about performance, you have to pay the price and use the instrumented version of performance measurement.
After fifteen years of performance measurement, I have come to the conclusion that sampling performance measurement is at best misleading, and at worst harmful because you draw erroneous conclusions and generalizations. I would not use it in any case where I really care about doing performance improvement.
[Another funny story: a year after the IDL book came out, I was in a technical review meeting for a design I did. One of the people sitting around the table said "That's not a particularly good design. It will have lousy performance". So I asked "Why?" He replied "Because it is doing a malloc, and storage allocation is too expensive for real programs". I started to object, and then I realized the context he was coming from, so I said "Oh, that's right, you're used to Unix, where the storage allocator sucks!". He became indignant, and said "I'm tired of you always running Unix down! What do you know about storage allocators, anyway?" Unix/linux fanboys are particularly prone to this; they are so convinced that Unix/linux is so advanced that no other operating system in history can compare to it, and they fail to realize that this is an operating system firmly rooted in the 1960s. They are convinced that C is the best language in history, and if they started on the PDP-11, they believe that the PDP-11 C compiler represents State of the Art (and yes, these people are still teaching this in 2011!). They need a serious dose of reality, and I decided I would give him one. So I pointed at him and said "hold that thought!" and walked out of the meeting. I went down the hall to my office and got a copy of the IDL book. I brought it back and opened it to Chapter 14, titled "Storage Allocation". I asked him "What does that chapter heading say?" He responded. I said "It describes a high-performance, low-fragmentation storage allocator that is quite possibly the fastest allocator in existence". I closed the book, and pointed to my name on the cover. "I wrote that allocator, and I wrote that chapter. So you might say, when it comes to what I know about storage allocation, I wrote the book!". I smiled. For the remainder of the year I worked there, he never again challenged my knowledge on a subject. The truth is that this was about the fourth allocator I had written in my career; since then I have written two more serious allocators. It continues to amaze me that when I teach my advanced Windows programming courses, none of the students have a clue as to how a storage allocator works, or the implications of what "buffer overrun" can do. They have no clue as to what memory fragmentation is, why C/C++ cannot really do storage compaction or garbage collection in native mode, and essentially are totally clueless about how new or malloc are implemented. I cover these in two other essays, "Inside Storage Allocation" and "About Memory Allocators"]
Each of these tests took some time to run. If I wanted to be more precise, I would run experiments for several hours and compute the mean and standard deviation of each average cost. But after a few dozen tests (only a few of which are shown here), we begin to get the idea that exceptions have virtually no cost, even in the low-performance 32-bit world. And the myth is BUSTED!
Note that to measure this one specific phenomenon, I had to disable all kinds of optimizations that you would not normally disable in the release mode; however, in a real application, the functions would not be so remarkably trivial as shown here. The bottom line is that if you want to understand how your application performs, you had better use a performance measurement tool, or do your own performance measurement using QueryPerformanceCounter.
![]()
The views expressed in these essays are those of the author, and in no way represent, nor are they endorsed by, Microsoft.